
I love making these little diagrams. It’s so cathartic. I remember reading this xkcd comic (Do you know the functions? Answers in the footnote1.) a long time ago, and thinking, “Yeah, I don’t get it either”.


I’ve always been a visual person, but I never realized that doing something like this would make things so much clearer. All those years earning a degree in computer science — learning Venn diagrams, flow charts, and the like — have finally come in handy.
- From left to right, top to bottom: square root of love, cosine of love (trigonometry), derivative of love (calculus), matrix multiplication of love (linear algebra), and someone help me out with the last one, it seems like another calculus equation with some constants thrown in the Fourier transformation of love (Hat tip to Edd Sowden for this one). [↩]
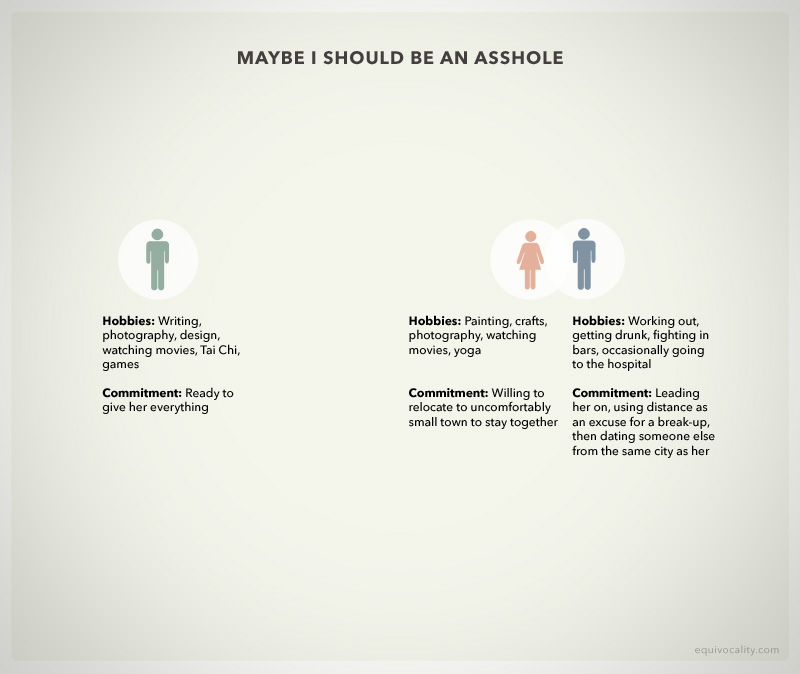
These are beautiful diagrams, great job! “Maybe I Should Be An Asshole” one made me laugh — it’s too true… I (and I’m sure many others) would enjoy seeing more of these.
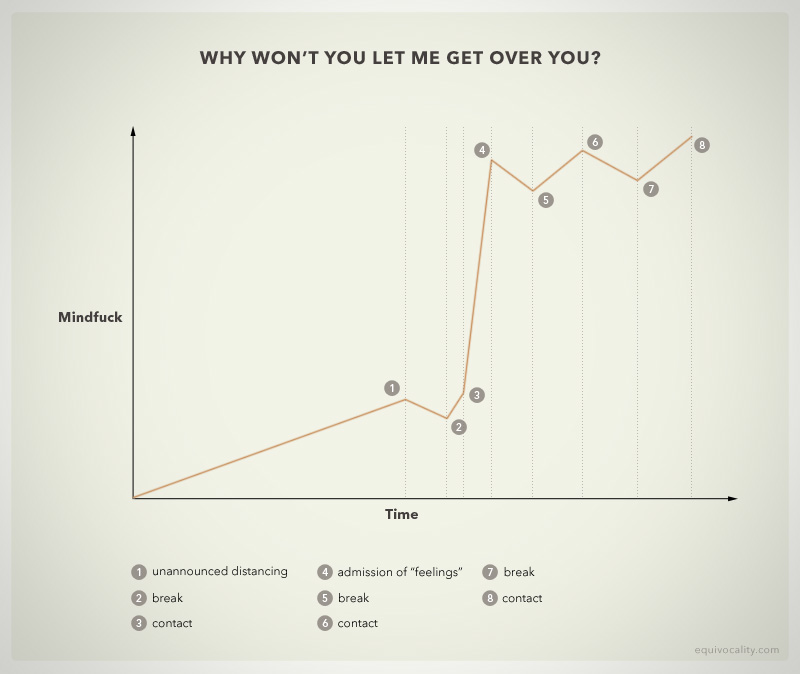
As much as I enjoyed making these, I can’t think of any more. They pretty much sum up the end of the relationship. The cynical parts that it’s left me with, at least.
I suppose I could write about the good parts in the beginning, but I don’t feel the same need to express that. Probably because I’ve written plenty about them already.
The last equation on the XKCD is a Fourier Transform of love.
Ah! I remember learning Fourier transformations in my networking course in university. Which I failed, the first time around. I can’t believe you recognized it! You must be a scholar, or use it on a daily basis, or both.
Those are marvelous! The 1st, 4th or last one is my favorite.
I think the last one is my favourite too. I just love how all the boxes are evenly spaced and line up with each other. It was probably the most challenging one to make.
You should really find other venues to publish these on, very funny in such an impeccably formal presentation.
\
If Only I hadn’t seen what spurred them I’d be laughing.
Oh, one has to laugh. By another venue, do you mean seeing one of these diagrams on a t‑shirt or a mug? Cause someone else has e‑mailed me and expressed enthusiasm about this, and I may consider doing it if there’s enough interest.
Yes, something like that. I think once a long time ago I saw someone on Craigslist make a very funny “You should date me because” series of diagrams and it was a big hit-
I think he made the “Best Of” list.
http://www.cafepress.com/cp/info/sell/
These were so much fun. Very very neat.
Neat is good. I tried to make them as simple and as striking as possible.
I loved these haha! Made my somewhat shitty day seem okay in the end :) thank you!
You’re welcome. :) I guess the ideas are universal enough for many to relate.
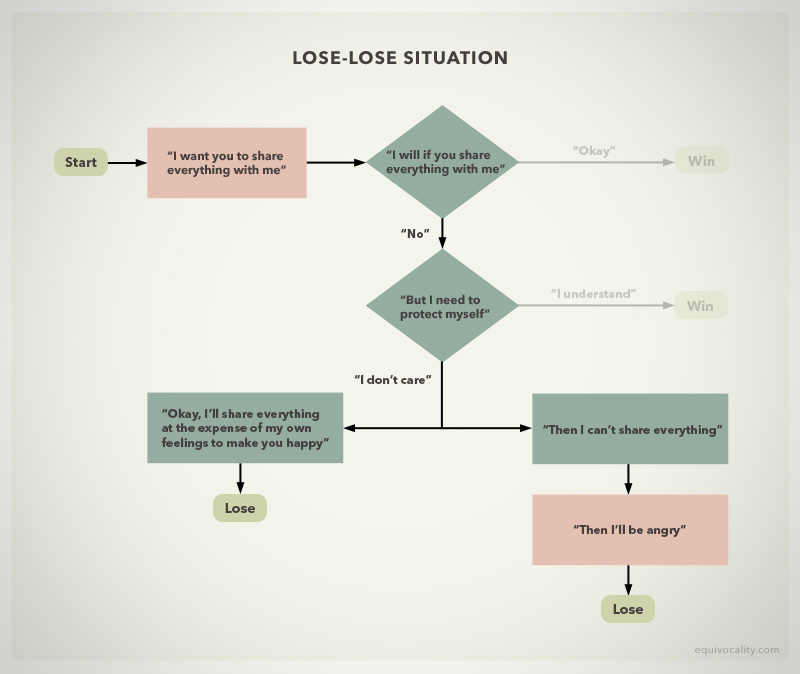
This is pretty good. It’s sad that I: A) understand all the flow charts perfectly. B) Feel the same way.
I hope you’re ready to get slammed because of digg.
Also, keep posting them!
I’m hoping for more diggs. Only 4 so far, and this deserves far more.
I’ve enabled caching, though my host should be able to handle it; I got slashdotted once too, and the server didn’t go down!
The third one is my favorite.
I wasn’t sure about that one, because it’s written from her perspective, so it’s not completely consistent with the rest of them. But I think the idea comes across clearly.
What happened to the Digg button?
I’m still fiddling with the implementation on single posts.
This is very, very sad… but it’s also very beautiful in a way.
You could make a wonderful book of things like this.